Analysis that actually answers back.
Move from high-level statements to underlying account details in a click. With built-in agentic AI and instant dimensional slicing, ClearBox FPA is the first analysis tool that works as fast as you think.
Everything you need to understand performance
Automatic reality checks
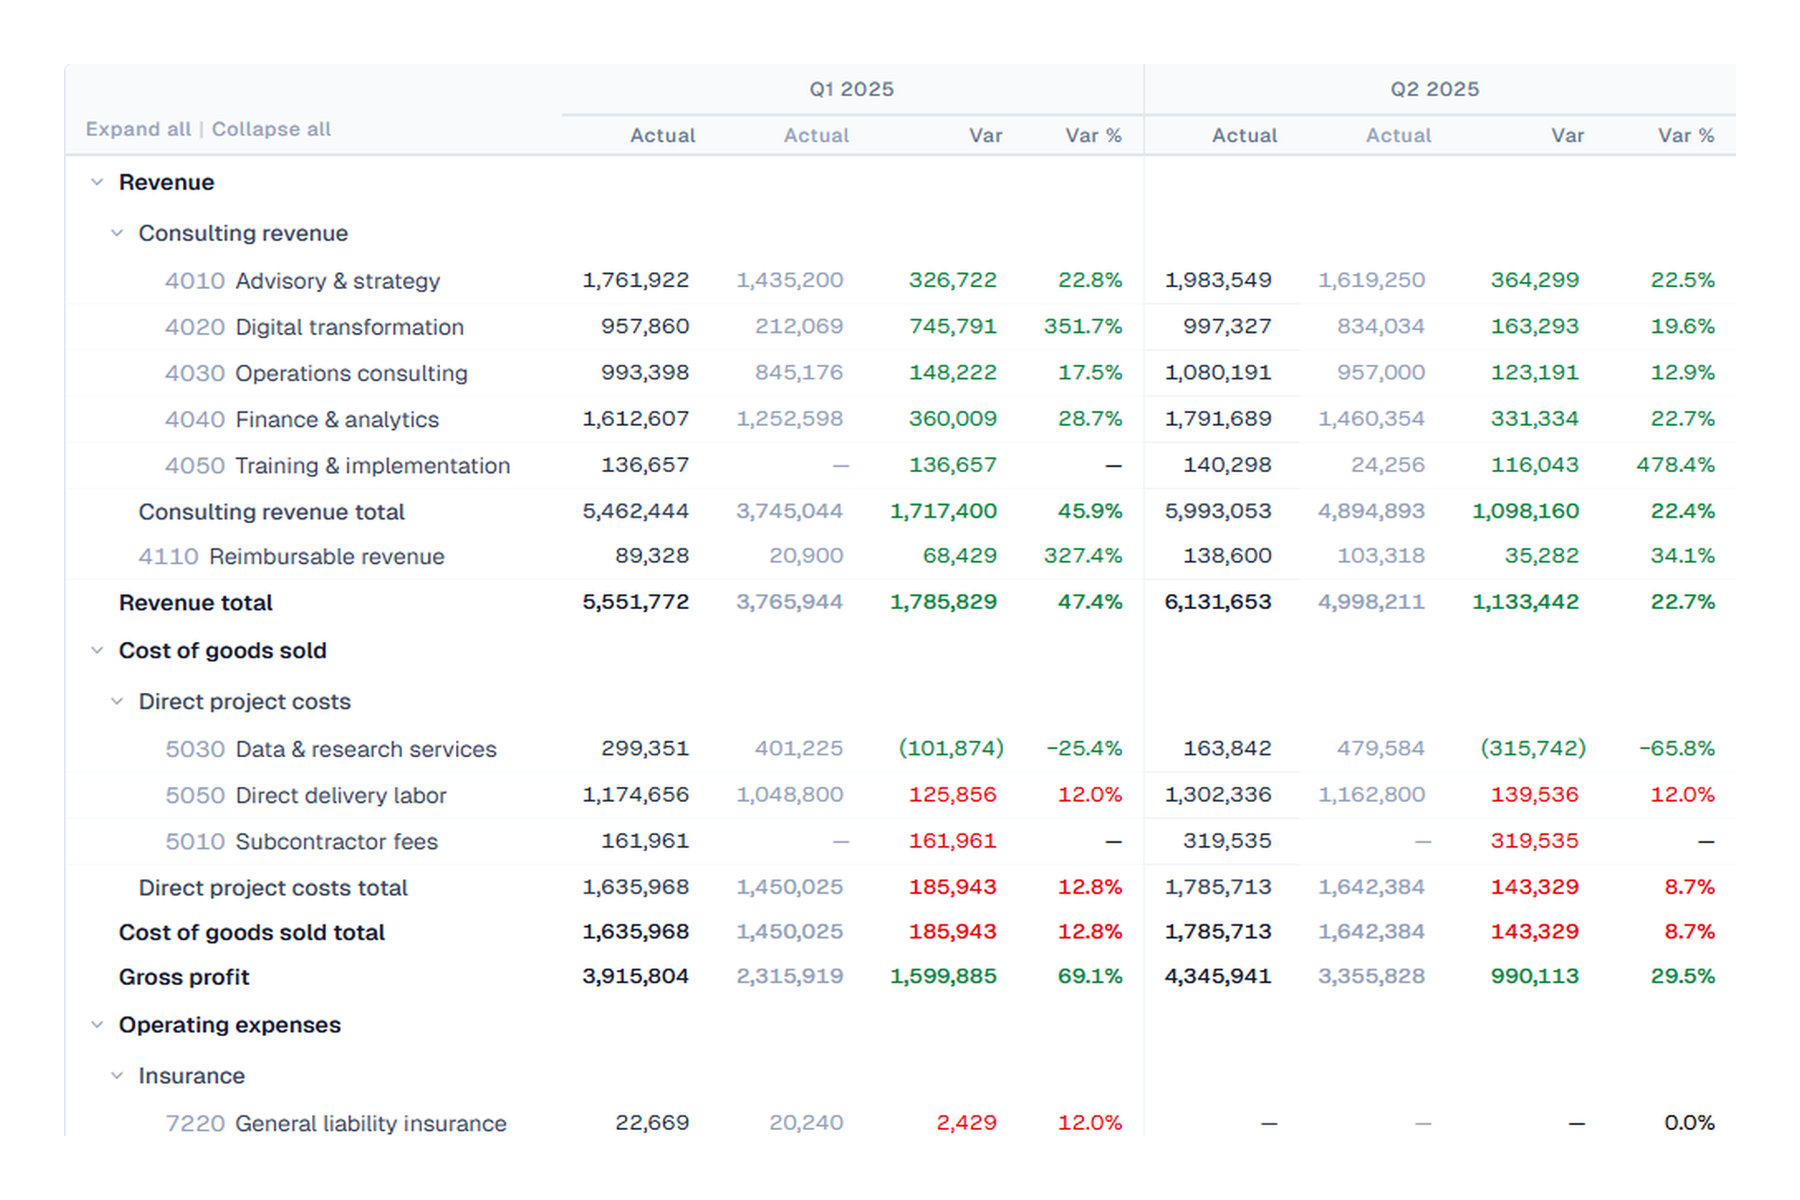
Stop the manual export-and-align dance. ClearBox FPA pulls live data from QuickBooks Online and maps it against your plan on your approval. Every view gives you the exact $ and % variance the second your books close.
- $ and % variance for every line
- Actuals update drafted for your review as QuickBooks syncs
- Compare any period range
Compare anything to everything
Put this year against last, or your "Aggressive Growth" forecast against your "Base Case." Run multi-scenario comparisons side-by-side in one view. No broken VLOOKUPs, no version-control nightmares — just instant perspective.
- Prior year comparison in any report
- Scenario vs scenario side by side
- Budget vs forecast vs actuals
Slice by business, not just accounts
Toggle your entire analysis by department, location, or product line. Isolate a single cost center or view the whole company without losing data integrity.
- Filter to a single segment
- Show multiple segments in one view
- Allocations stay accurate however you slice
Connect dollars to deeds
Financials only tell half the story. Flip to the Drivers tab to see the operational metrics — headcount, units, or customer churn — that actually dictated the result. Use the same variance logic you use for your P&L on the KPIs you actually manage.
- All drivers in a dedicated analysis view
- Compare actuals vs forecast for operational metrics
- Understand what’s moving the financial result
Audit-level depth, one click away
Don't just wonder why a number is off. Drill directly into the account detail to see the specific period movements and general ledger entries. Move from the boardroom view to the ledger level without ever leaving the page.
- Account-level detail on demand
- Movement by period
- No export required
Sensitivity analysis
Pick a metric — net income, free cash flow, revenue — and ClearBox FPA shows you what inputs actually move the needle most.
- Auto-discovers all variable assumptions
- Tornado chart ranked by impact
- Results ready in seconds
Ask your data, get the answer
Skip the manual filtering and formula auditing. Use ClearBox Intelligence to interrogate your financials in plain English.
Why did Marketing exceed budget in October?
ClearBox Intelligence identifies the specific GL spike or vendor that drove the variance.
Which product line has the highest margin volatility?
ClearBox Intelligence slices the dimensions for you.
Find the source of the Other Expenses increase.
ClearBox Intelligence drills into the ledger and summarizes the movement for you.
Built-in logic that doesn't break
ClearBox FPA's financial engine does the heavy lifting so your comparisons stay accurate across every version of the truth.
- Scenario vs. Scenario: Put your "Base Case" against "Aggressive Growth" side-by-side.
- Budget vs. Forecast: See how your latest outlook tracks against the original plan.
- Custom KPI Library: Enable dozens of pre-built metrics or build your own complex logic that references accounts and drivers across the entire model.
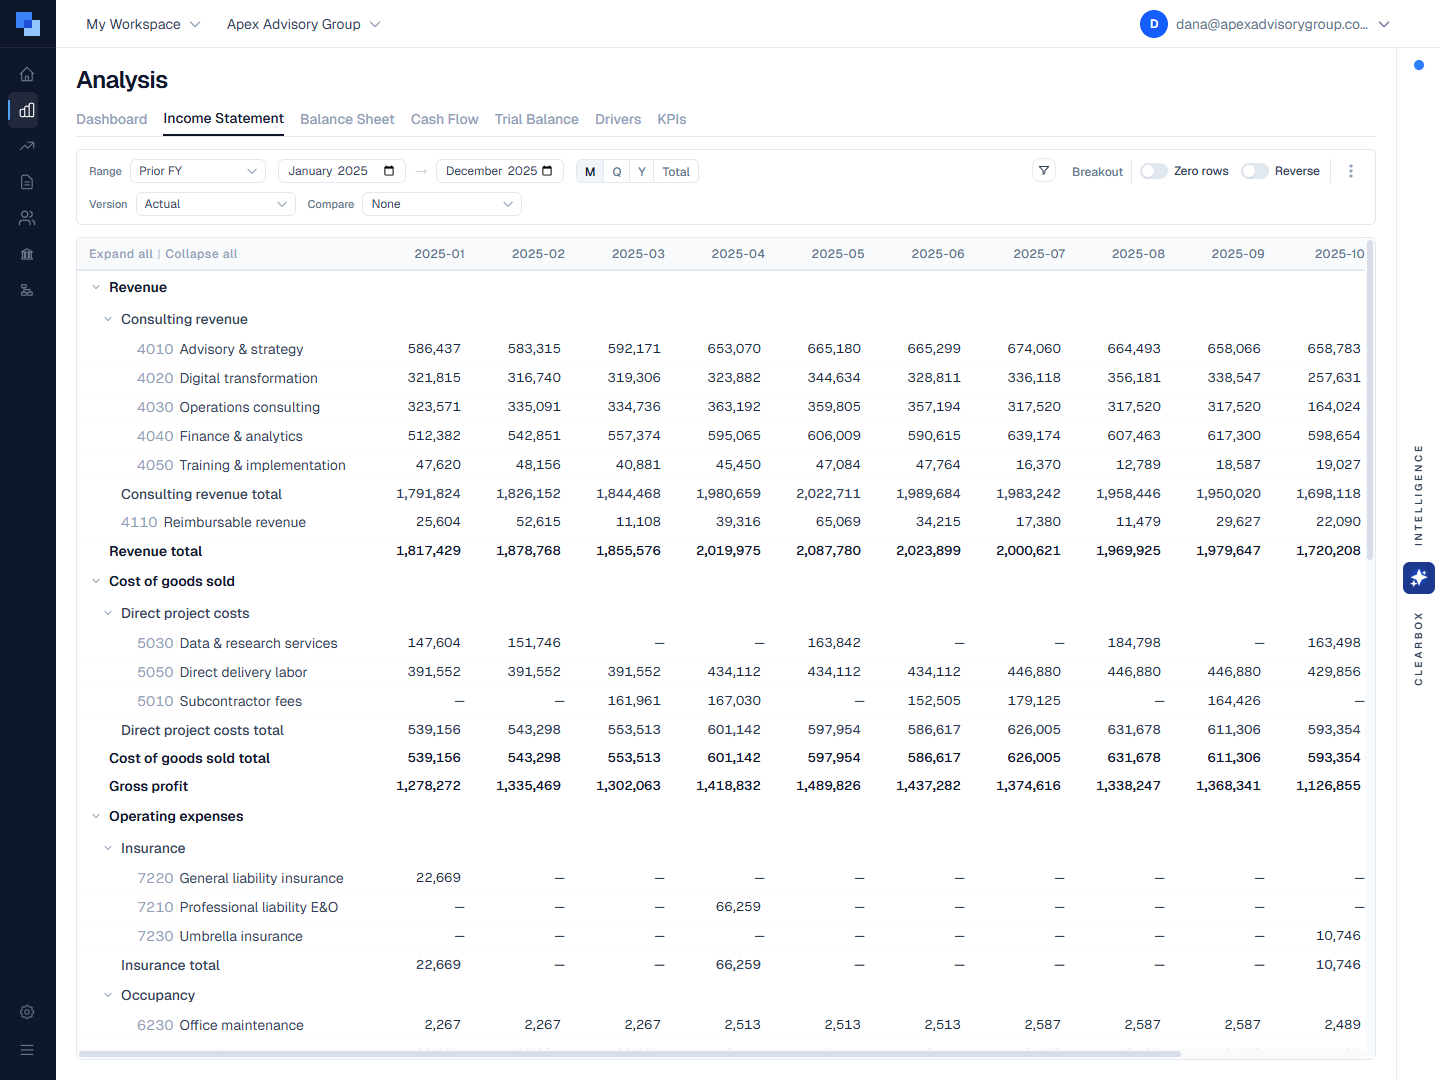
From 30,000 feet to the general ledger
Don't just look at a variance — solve it. ClearBox FPA allows you to drill into any account detail to see the raw period movement.
Account-level transparency
- See exactly how your ledger accounts roll up into your high-level categories.
- Validate your totals in real-time without having to open your accounting software.
Trace period movement
- Distinguish between recurring and one-time costs on your approval.
- Confirm that period-over-period growth is driven by the logic you expect.
Zero-friction investigation
- Stay inside the model while you hunt for the "why."
- Your dimensional slice filters stay active even when you’re looking at the ledger level.
Find the levers that actually move the needle
Stress-test your assumptions. Pick a metric like net income or free cash flow and see every assumption in your model ranked by impact.
- Net income, EBITDA, operating income, gross profit, revenue, and cash flow.
- Tornado chart shows you a ranked list of which assumptions have the biggest impact.
- Identify the "hidden" drivers you didn't realize your forecast was sensitive to.
![Find the [tw="text-blue-600"]levers[/tw] that actually move the needle](/static/img/mocks/marketing/cms-meeting-prep-20260526-v2/sensitivity-analysis-4x3.png)
Stop guessing. Start knowing.
14-day free trial. No credit card required.